

INTRODUCTION
Nurses are often exposed to high levels of workplace stress which puts them at risk of burnout (Tabakakis et al., 2020). Burnout is an occupational syndrome resulting from chronic workplace stress that has been unsuccessfully managed (World Health Organization, 2019). Burnout in nursing has three main dimensions: emotional exhaustion, a tendency to depersonalise patient encounters, and a lack of personal accomplishment (Maslach et al., 2001). Nurse burnout appears to be a common phenomenon worldwide and has been linked to increased job turnover, risks to patient safety, and reduced patient satisfaction (Moloney, Boxall, Parsons, & Cheung, 2018; Moloney, Gorman, et al., 2018).
Research examining workplace stress and burnout in nurses within the Aotearoa New Zealand (NZ) context highlights issues that have been ongoing for the last two decades (Tabakakis et al., 2020). A 2001 study found that 32.9% of NZ nurses were in the advanced stages of burnout (Hall, 2001), while a 2007 survey of NZ and Australian nurses found that stress was on the rise and forecast nurses would experience poorer mental and physical health in years to come (Chang et al., 2007). A study in 2018 in Aotearoa NZ found that workload and job emotional demands had the largest effects on burnout, with burnout being a significant predictor of nurse intention to leave the profession (Moloney, Boxall, Parsons, & Cheung, 2018; Moloney, Boxall, Parsons, & Sheridan, 2018; Moloney, Gorman, et al., 2018). Two years later, Tabakakis et al. (2020) explored burnout in NZ registered nurses and concluded that the practice environment, specifically exposure to negative acts such as bullying, was associated with burnout. They further noted the toll of emotional labour in nursing, highlighting how persistent exposure to workplace stressors such as high workloads, insufficient organisational support, and patient-related emotional demands contributes to high levels of personal, work-related, and client-related burnout (Tabakakis et al., 2020).
THE STUDY
The above findings all preceded the COVID-19 pandemic, which was a turning point that significantly worsened nurses’ psychological health, with global studies reporting elevated rates of burnout (34% emotional exhaustion), depression (up to 53%), anxiety (40%), and stress (64%), as well as increased depersonalisation and reduced personal accomplishment among nurses (Galanis et al., 2021; García-Vivar et al., 2022; Pratiwi et al., 2023).
The present study aimed to investigate the levels of burnout in nurses working in Aotearoa NZ two years after COVID-19 was declared a global pandemic (World Health Organization, 2020). An additional objective of this study was to evaluate the factor structure of the Maslach Burnout Inventory - Human Services Survey, or MBI-HSS (Maslach & Jackson, 1981) in the NZ nurse population, which had not been undertaken previously. In order to gain a deeper understanding of burnout in nurses working in Aotearoa NZ, the current research examined differences in burnout, stress and mental well-being among sociodemographic nurse groups, as well as the relationship of burnout with stress and mental well-being. Additionally, qualitative data was used to identify the challenges nurses faced in their work that might contribute to the onset of burnout symptoms.
The research questions of the present study were:
-
What is the factor structure of MBI-HSS in a sample of nurses working in Aotearoa New Zealand?
-
Are there differences in burnout, stress, and mental wellbeing between different sociodemographic groups?
-
What is the relation, if any, between stress and burnout in the current sample?
-
What is the relation, if any, between mental wellbeing and burnout in the current sample?
-
What does the qualitative data reveal about the challenges nurses face and the aspects of work that affect their wellbeing?
METHODS
Sample
A sample of 361 participants was recruited (see under the procedure section below). Almost all participants were females (97.5%), while an approximately equal distribution of age ranges was observed. The majority of respondents were European New Zealanders (65.7%). Half of the respondents worked between 21 to 39 hours per week (52.4%) in day shifts (49.0%). Additionally, several areas of main practice were reported. Table 1 shows the sociodemographic characteristics of the sample.
Measures
A questionnaire battery comprising of three scales, sociodemographic questions and two open-ended questions was prepared. The open-ended questions were: “What do you find most challenging about your job? Please explain/give examples” and “What aspects of your work affect your wellbeing?” Three scales were used and described below.
Maslach Burnout Inventory-Human Services Survey (MBI-HSS)
The MBI-HSS (Maslach & Jackson, 1981) includes 22 items that assess three facets of burnout: emotional exhaustion (nine items), personal accomplishment (8 items), and depersonalisation (five items). Emotional exhaustion evaluates feelings of fatigue and over-extension by one’s work, whereas personal accomplishment refers to feelings of work competence and productivity. Depersonalisation is characterised by cynical and impersonal responses towards patients. Sample items included: “I feel emotionally drained from my work”, “I can easily understand how my patients feel about things”, and “I don’t really care what happens to some patients”, respectively. Responses were provided on a 6-point Likert scale, ranging from 0 (never) to 6 (every time). Three separate sum scores were calculated for the items included in each facet, with higher scores indicating greater levels of the facet under investigation. The MBI-HSS has displayed sound psychometric properties in various previous studies (Maslach et al., 2018) and did so as well in the present study: emotional exhaustion (α = .90), personal accomplishment (α = .76), and depersonalisation (α = .79). Cronbach’s alpha (α) is a measure of internal consistency reliability, indicating how closely related the items within each subscale are; values above .70 are generally considered acceptable and reflect that the scale items reliably capture the same underlying construct.
Perceived Stress Scale (PSS)
The PSS (S. Cohen et al., 1983) consists of 10 items that evaluated the extent to which individuals perceived their life situations as stressful. Sample items were “How often have you been upset because of something that happened unexpectedly?” and “How often have you been angered because of things that were outside of your control?” Responses were provided on a 7-point Likert scale, ranging from 1 (never) to 7 (every time). Four items were reverse scored, so that higher scores reflected greater stress. A sum score was computed for all items. A review of 19 articles evaluating the psychometric properties of PSS showed satisfactory reliability and validity (E.-H. Lee, 2012). In the present study, the scale showed good reliability α = .87.
Warwick-Edinburgh Mental Well-Being Scale (WEMWBS)
The WEMWBS (Stewart-Brown & Janmohamed, 2008) consists of 14 items that assessed mental well-being during the previous two weeks, including aspects of subjective well-being and psychological functioning. Sample items included “I’ve been feeling optimistic about the future” and “I’ve been able to make up my own mind about things”. Responses were provided on a 7-point Likert scale, ranging from 1 (never) to 7 (every time). A sum score was calculated for all items, with higher scores indicating greater mental well-being. The psychometric properties of WEMWBS have been well-established in several studies (see Stewart-Brown & Janmohamed, 2008 for a review). In the present study, the WEMWBS had an α = .93.
Procedure
Ethical approval was obtained from the University of Auckland prior to study commencement (Auckland Health Research Ethics Committee Ref: AH24573). Participant recruitment was conducted through Facebook advertisements and the mailing lists of the New Zealand Nurses Organisation (NZNO) and Nurse Executives Aotearoa (NEA). All participants volunteered for the study and gave consent to be part of it. Upon receipt of their agreement to participate, they were emailed a link to the questionnaire battery which they completed online.
Data analysis
To determine the factor structure of the MBI-HSS, a maximum likelihood analysis with direct oblique rotation was conducted. An oblique rotation was selected due to the significant intercorrelations between factors (Table 2). A series of inferential analyses including Spearman’s rho correlation analysis, one-way between subjects ANOVA, and Bonferroni post-hoc comparisons, were used in order to identify the differences in burnout, stress, and mental wellbeing among different sociodemographic NZ nurse groups. Multiple regression analyses were used to evaluate the relation between stress and burnout, and mental wellbeing and burnout in the current sample.
A thematic analysis was undertaken to identify the challenges nurses face and the aspects of their work that affect their well-being. The six-step framework of Braun and Clarke (2006) was used to code the responses given to the open-ended questions. First, the responses were read multiple times to become familiar with the data and preliminary notes were taken. Afterwards, initial codes were generated to organise data in a systematic and meaningful manner. The third step involved the organisation of the codes into themes, defined as patterns that communicate interesting insights (Braun & Clarke, 2006). During the fourth step, themes were reviewed to assess if they were adequately supported by the data, overlapped with each other, and potential subthemes within the themes were identified. Then, themes were refined to reveal the essence of each theme (Braun & Clarke, 2006). A thematic map presenting the themes and subthemes was created at this stage (see Figure 6). Finally, themes and subthemes were presented, interpreted, and illustrated with representative quotes.
Data analysis was undertaken by the first author (GT). Quantitative analyses, including factor analysis, correlations, ANOVA analyses, and regression analyses, were conducted by GT and independently reviewed by co-authors (DLF, MT, CRD) for accuracy. Qualitative data were thematically analysed by GT following Braun and Clarke’s (2006) six-step framework, with the coding and thematic map checked and discussed with co-authors (DLF, MT, CRD) to ensure validity and confirmability.
RESULTS: QUANTITATIVE
Factor structure of the Maslach Burnout Inventory-Human Services Survey
The maximum likelihood analysis with direct oblique rotation revealed three factors that had eigenvalues over Kaiser’s criterion of 1, which explained 28.7%, 11.7%, and 5.5% of the variance, respectively. In total, the model accounted for 45.9% of the variance and was statistically significant, χ(168) = 457.69, p < .001. For each factor, items with loadings ≥ .30 were considered significant (Field, 2018) and are presented in bold in Table 3. The first factor included the nine items assessing emotional exhaustion; the second factor the eight items evaluating personal accomplishment; and the third factor the five items examining depersonalisation. Overall, the NZ factor structure reflects the three dimensions of burnout. It should be noted however that one item from the first factor had a significant loading in the third factor, whereas two items from the third factor had significant loadings on the first factor, a not unexpected finding, considering the significant correlation between the first and the third factor as shown in earlier studies (Kalliath et al., 2000; Whitehead et al., 2000). Cross-loading items were retained if they loaded ≥ .40 on their primary intended factor and if the secondary loading was at least .15 lower, following accepted psychometric guidelines (Tabachnick & Fidell, 2013). These items were also reviewed for theoretical relevance to their core construct and contribution to internal consistency. None were removed solely due to cross-loading, as they continued to show meaningful alignment with the MBI-HSS subscale structure and contributed to acceptable reliability across all three factors (Cronbach’s α > .70). While this approach supports comparability with existing Maslach Burnout Inventory validation studies, the presence of cross-loadings remains a potential limitation in terms of construct clarity and is acknowledged as such in the limitation section.
Within sample comparisons of Maslach Burnout Inventory-Human Services Survey (MBI-HSS) facets
A series of inferential analyses were conducted to evaluate if there was a statistically significant difference in burnout dimensions among sociodemographic groups. The burnout dimensions assessed were emotional exhaustion, personal accomplishment, and depersonalisation. The sociodemographic variables assessed were all the variables presented in Table 1. Only significant findings are displayed to enhance the readability of the section. See Supplementary File for further analyses.
Age
A Spearman’s rho correlation analysis indicated a statistically significant weak positive relation between age and personal accomplishment (p = .009), suggesting that older individuals experience greater feelings of work competence and productivity. In addition, a statistically significant negative relationship of moderate strength between age and depersonalisation was identified (p < .001), indicating that older individuals exhibit less cynical and impersonal responses towards patients. Table 4 shows the correlation coefficients.
Main area of practice
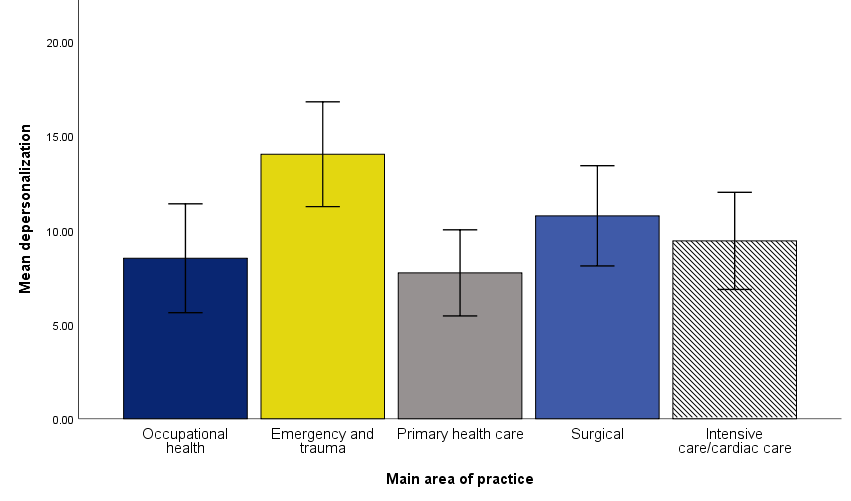
A one-way between subjects ANOVA showed a statistically significant difference in depersonalisation among areas of practice, F(4, 126) = 3.72, p = .007, ηp2 = .11. Bonferroni’s post-hoc comparisons indicated a statistically significant difference between nurses working in emergency and trauma and those working in occupational health (p = .028) and primary health care (p = .007). Nurses working in emergency and trauma displayed greater depersonalisation than those working in other areas. Table 5 shows the descriptive statistics and Figure 1 the mean differences.

Working hours distribution
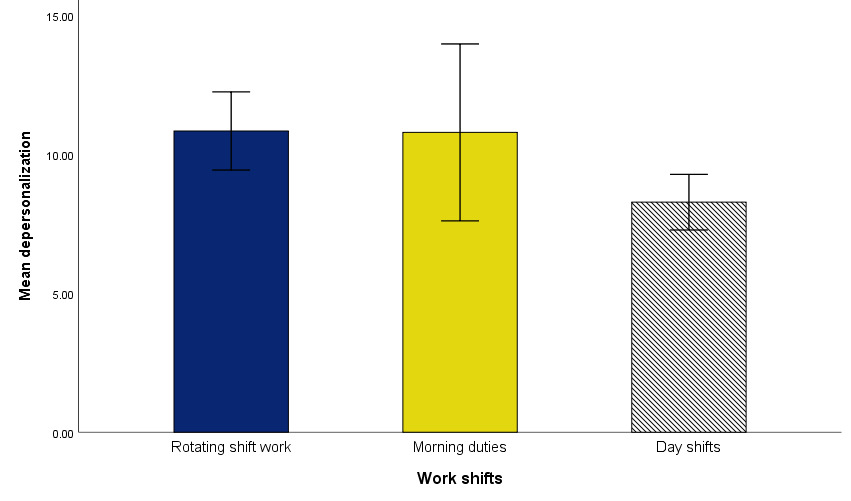
A one-way between subjects ANOVA indicated a statistically significant difference in depersonalisation among work shifts, F(2, 289) = 4.96, p = .008, ηp2 = .033. Bonferroni’s post-hoc comparisons showed a statistically significant difference between nurses with rotating shifts and those with day shifts (p = .009). Nurses working in rotating shifts expressed greater depersonalisation than those working in day shifts. Table 6 shows the descriptive statistics and Figure 2 the mean differences.
Within sample comparisons of Perceived Stress Scale (PSS)
A series of inferential analyses were performed to explore if there was a statistically significant difference in stress among sociodemographic groups of nurses. The sociodemographic variables evaluated were all the variables presented in Table 1. Only significant findings are displayed to strengthen the readability of the section. See Supplementary File for further analyses.
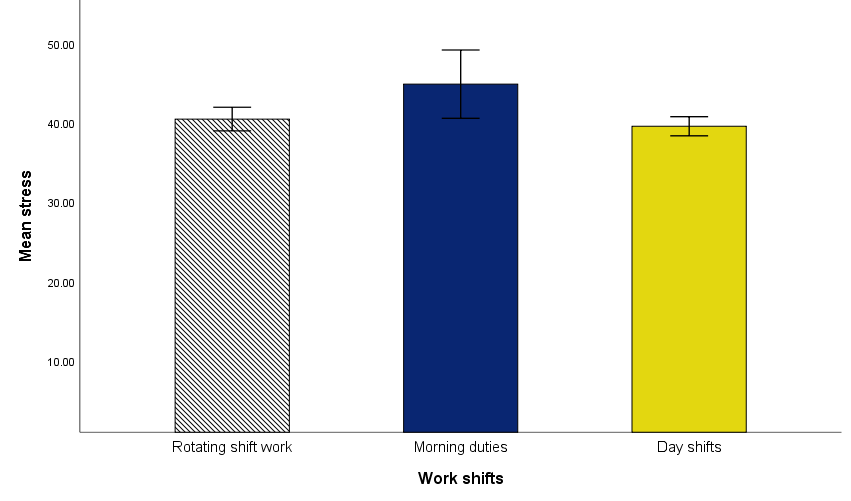
A Spearman’s rho correlation analysis showed a statistically significant weak negative relation between age and stress [rs(355) = -.21, p < .001], indicating that older individuals experienced lower stress. In contrast, a statistically significant positive weak relationship between working hours per week and stress was identified [rs(355) = .11, p = .034], suggesting that individuals working more hours exhibit greater stress. Finally, a one-way between subjects ANOVA indicated a statistically significant difference in stress among work shifts, F(2, 294) = 3.85, p = .022, ηp2 = .026. Bonferroni’s post-hoc comparisons displayed a statistically significant difference between nurses with morning duties and those with day shifts (p = .019). Nurses with morning duties experienced greater stress than nurses working in day shifts. Table 7 shows the descriptive statistics and Figure 3 mean differences.

Within sample comparisons of Warwick-Edinburgh Mental Well-Being Scale (WEMWBS)
A series of inferential analyses were conducted to assess if there was a statistically significant difference in mental well-being among sociodemographic groups. The sociodemographic variables examined were all the variables presented in Table 1. Only significant findings are reported to enhance the readability of the section. See Supplementary File for further analyses.
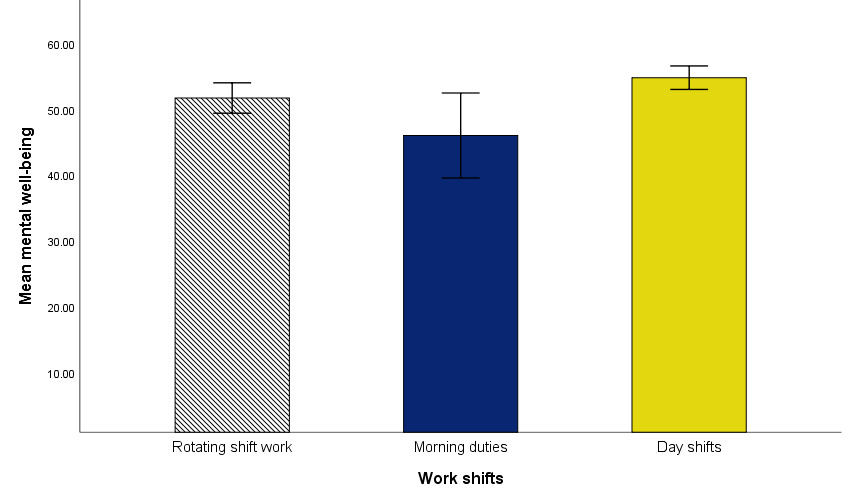
A Spearman’s rho correlation analysis showed a statistically significant weak positive relation between age and mental well-being [rs(358) = .20, p < .001], indicating that older individuals experience greater mental well-being. To the contrary, a statistically significant negative weak relation between working hours per week and mental well-being emerged [rs(358) = -.16, p = .003], suggesting that individuals working more hours display lower mental well-being. Finally, a one-way between subjects ANOVA indicated a statistically significant difference in mental well-being among work shifts, F(2, 296) = 5.72, p = .004, ηp2 = .037. Bonferroni’s post-hoc comparisons showed a statistically significant difference between nurses with morning duties and those with day shifts (p = .008). Nurses with morning duties experienced lower mental well-being than nurses working in day shift. Table 8 shows descriptive statistics and Figure 4 mean differences.
Burnout and stress
A multiple linear regression analysis was conducted to examine whether burnout dimensions were statistically associated with stress. Burnout comprised three facets, emotional exhaustion, personal accomplishment, and depersonalisation (n = 361). A statistically significant model was identified [F(3, 348) = 74.58, p < .001], which accounted for 38.6% of the variance in stress (R2= .391; R2adj. = .386). Emotional exhaustion was statistically associated with higher levels of stress (p < .001), meaning that as emotional exhaustion increased, so did reported stress levels. In contrast, personal accomplishment was statistically associated with lower stress (p < .001), indicating that nurses who reported greater feelings of personal accomplishment experienced lower stress. Emotional exhaustion had a stronger association with stress than personal accomplishment. Depersonalisation did not emerge as a statistically significant predictor of stress (p = .13). These results suggest that higher levels of emotional exhaustion and lower levels of personal accomplishment are statistically associated with greater stress among nurses. Table 9 shows regression coefficients.
Burnout and mental well-being
A multiple linear regression analysis was performed to evaluate if burnout was a statistically significant predictor of mental well-being. Burnout included three facets: emotional exhaustion, personal accomplishment, and depersonalisation (n = 361). A statistically significant model was identified [F(3, 348) = 79.92, p < .001], which accounted for 40.3% of the variance in mental well-being (R2= .408; R2adj. = .403). Emotional exhaustion was a statistically significant negative predictor of mental well-being (p < .001), whereas personal accomplishment was a statistically significant positive predictor of mental well-being (p < .001). Emotional exhaustion was a stronger predictor of mental well-being than personal accomplishment. Depersonalisation was a non-statistically significant predictor of mental well-being (p = .75). Consequently, it could be inferred that nurses experiencing lower emotional exhaustion and higher feelings of personal accomplishment are more likely to exhibit greater mental well-being. Table 10 shows regression coefficients.
RESULTS: QUALITATIVE
Work challenges
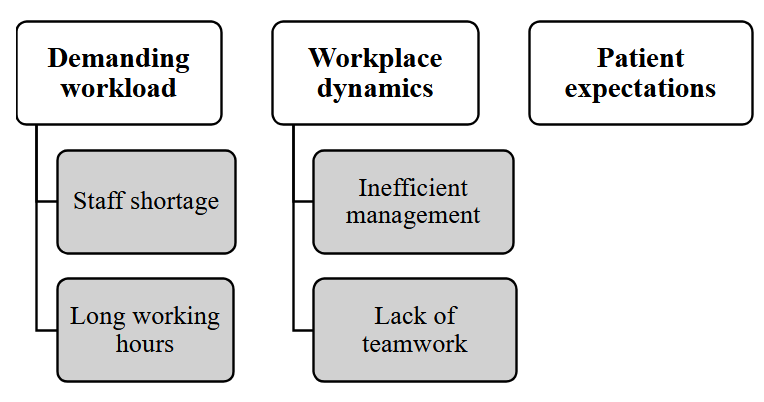
The qualitative data analysis revealed three superordinate themes: demanding workload, workplace dynamics, and patient expectations. Demanding workload included two subthemes, staff shortage and long working hours. Workplace dynamics comprised two subthemes, inefficient management and lack of teamwork (Figure 5).

Demanding workload
The most commonly cited source of distress for nurses was the demanding and sometimes exhausting workload they faced on a frequent basis, caused by a lack of sufficient and/or adequate staff and by doing overtime work.
Staff shortage. A considerable number of respondents reported that there was a significant shortage of nursing staff, along with an excess of less skilful and/or inexperienced nurses. Both issues interfered with the proper execution of respondents’ duties, especially for nurses with senior responsibilities:
I am a practice nurse, a patient load of 5500 and one GP [general practitioner]. I am expected to do the work of 6 nurses as the workload has not changed even though I am the only nurse.
I find working with non nursing-experienced staff a huge challenge, as they always got complaints concerning the residents. The other issue as a registered nurse to oversee 60 residents as well 6 - 8 staff is a huge problem. Plus not being able to take proper breaks due to the current shortage. I feel burnout.
Long working hours. Working overtime was reported by many respondents. Shift work and constantly being on call were reported to have the most adverse impact on nurse well-being:
Exhaustion as I’m getting older from shift work. [I] have to do 4 night shifts each month as well as early and late shifts-don’t bounce back like i used to in the past after night shifts. [Its] emotionally and physically draining.
On call commitments. Not being able to socialise when at home because I am on call.
Workplace dynamics
Dysfunctional workplace dynamics was another major source of distress for participants. Examples including inappropriate management practices and hostile colleague behaviours.
Inefficient management. The data suggests that certain managers did not properly address nurse observations and complaints, which in certain cases posed a risk to patient outcomes:
Lack of support and understanding from management. When we are busy to the point where it is unsafe, even when we ask for help there is very limited support. And after it is dismissed because they see that we have coped, so they don’t deem it to have been unsafe. When in reality we only cope/manage those situations because if we don’t we would be neglecting our patients and putting them in danger.
Management not listening/choosing to listen to risks, dangers, threats by aggressive patients and families until something serious happens.
Lack of teamwork. In addition, numerous respondents faced a lack of teamwork, ranging from cliques and gossiping to instances of bullying:
Mainly the cliques and hush hush behind people’s backs, the passive aggression of staff and the boss’ use of gaslighting the staff.
Some staff are just nasty and use bullying to make themselves feel better by belittling others.
Patient expectations
A large number of respondents reported that patients often had unrealistic expectations of them, demanded exclusive attention, and displayed disrespectful attitudes; a stance that made nurses feel unappreciated and emotionally drained.
The lack of respect from the patients towards nursing staff. They can be so entitled and think they are the only patient to see that day. Some are not understanding of having to reschedule due to having no nurses.
Condescending attitudes to nurses from patients and families. People who tell you to do as they say 'cos they are paying my wages through their taxes. There are people like that who are verbally aggressive. That attitude can stay with me for days.
DISCUSSION
Results indicated that the MBI-HSS demonstrates satisfactory psychometric properties and is composed of three facets: emotional exhaustion, personal accomplishment, and depersonalisation. Regarding differences in burnout among sociodemographic groups, our study suggested that older individuals experienced greater personal accomplishment and less depersonalisation. The relation between age and burnout has been explored in previous studies. For example, Ramírez-Elvira, et al. (2021) found that younger nurses are consistently at higher risk of emotional exhaustion and lower personal accomplishment, while older nurses generally report lower burnout scores across dimensions. Age was one of the strongest protective factors: more years of experience and maturity in the profession were linked with greater resilience to burnout symptoms. Similarly, Moya-Salazar, et al. (2023) identified age the only significant predictor of burnout in multivariable analysis, with nurses aged 20-30 having higher burnout scores and older nurses reporting lower levels of burnout. In our study, older nurses were shown to experience lower stress and greater well-being. This is in line with previous studies and points to the fact that health institutions as well as managers in healthcare settings should be aware that younger staff might be at greater risk of burnout. We recommend preventative measures be taken to address this risk. Potential measures could include: ensuring safe staffing ratios, so younger nurses are not disproportionately exposed to heavy workloads; rotating tasks to balance emotionally demanding work (for example, frequent exposure to patient death) with less intense duties; providing progressive responsibility: gradually increasing task complexity as skills and confidence grow; or offering structured orientation and mentoring programs where senior nurses support younger colleagues.
Nurses who worked in emergency and trauma displayed greater depersonalisation in our study than nurses working in occupational health and primary health care. This is consistent with existing literature which suggests that nurses working in high stress areas such as emergency, oncology, paediatric and primary care exhibit higher levels of burnout (Woo et al., 2020). Underlying reasons for this could be attributed to the emotionally taxing nature of the work, dealing with death, and with highly distressed patients and families (Boerner et al., 2017; Cybulska et al., 2022; Groves et al., 2022; Lief et al., 2018).
The NZ nurses in our study displayed high emotional exhaustion and depersonalisation. This could be attributed to several factors. Firstly, the NZ data was collected in the aftermath of a global pandemic that strained the resources of the healthcare system, and of nurses in particular, to a high degree. This was likely amplified by the existing nurse shortage (Brettkelly, 2023) and our qualitative data presents the impact of that on nurses. Many respondents struggle with high workloads due to staff shortages or to positions being filled by inexperienced staff. Nurses who report heavy workloads and insufficient staffing experience higher levels of burnout (Holdren et al., 2015; Humphries et al., 2014).
Our qualitative data highlights two other contributors to burnout: organisational factors related to dysfunctional workplace dynamics and the emotional labour involved in negative patient interactions. Workplace dynamics such as lack of appropriate manager and colleague support, as well as the presence of offensive behaviours such as bullying, have been identified in our study as significant sources of stress, emotional exhaustion, and depersonalisation. Other studies have also found that inadequate support from supervisors contributes to the onset of burnout symptoms (Moloney, Boxall, Parsons, & Cheung, 2018; Moloney, Gorman, et al., 2018) with workplace bullying also contributing to burnout in nurses (Giorgi et al., 2016). Nurses frequently engage in emotional labour, which involves managing their emotions to meet the expectations of patients. In our sample, respondents indicated that unrealistic patient expectations as well as negative comments significantly affected their wellbeing. The relation between emotional labour and nurse burnout has been shown to result in nurses experiencing emotional exhaustion and reduced job satisfaction (Feng et al., 2024).
Lastly, in our sample nurses working in rotating shifts expressed greater depersonalisation than those working in day shifts. Nurses who worked more hours or who had morning duties exhibited greater stress and lower mental well-being. These findings are consistent with previous studies that explored relations between shift work and burnout and found that shift workers are more at risk of developing burnout symptoms (Vidotti et al., 2018; Wisetborisut et al., 2014).
The findings from our study have implications for potential interventions preventing or targeting burnout in nursing staff. The identified contributors to nurse burnout, namely high workload, high emotional demands, shift work, poor support from supervisor or colleagues, dysfunctional workplace dynamics, incivility or disrespect, and bullying are considered psychosocial hazards (Safe Work Australia, 2022). Psychosocial hazards are aspects of work that carry the potential to cause psychological or physical harm through prolonged, frequent or intense stress response activation (Cobb, 2022). We recommend these psychosocial hazards be managed through a systematic risk management process which should target their elimination or reduction, in accordance with the International Standard ISO 45003 (International Organization for Standardization, 2021). Employing organisational level interventions that aim to change the way work is designed and managed should be the first line of action for hazards that cannot be eliminated, such as shift work or patient offensive behaviours (International Organization for Standardization, 2021).
Reducing staff shortages is a major issue that the government and healthcare organisations need to act on. Sufficient time for recovery and reduction in work overload are paramount in securing nurse mental wellbeing, as called for in other papers, including Dall’Ora’s meta-review of burnout in nursing (2020) or Nagel & Nilsson’s (2025) study on predictors of nurses’ work-related mental health. Workplace interventions could also be helpful, especially in addressing dysfunctional workplace dynamics and increasing collaboration among colleagues, evidence in a meta-review by Cohen, Pignata et al. (2023). There is a large body of evidence suggesting that mindfulness-based interventions have positive effects on reducing nurse burnout and stress (Dou et al., 2025; M. Lee & Cha, 2023; Ramachandran et al., 2023; Sharin et al., 2025; Talebiazar et al., 2025). A word of caution is needed here: mindfulness-based programmes should not replace or be the first type of intervention to address the psychosocial hazards causing burnout in nurses. Although they can be effective, long-term exposure to hazards is likely to negatively affect nurses. Therefore, interventions targeting organisational-wide approaches to eliminate or reduce hazards through work redesign or system improvement should be prioritised.
Younger nurses working in emergency and trauma and rotating shifts are in a more vulnerable position and hence, interventions are strongly recommended for this population. One example could be ensuring regular debrief sessions with staff, peer support or mentoring programmes for younger nurses, as well as attempts to reduce exposure through job rotation. Additionally, adequate training for supervisors is recommended so that they are aware of this fact and the need to provide supportive practices and to recognise signs of burnout in staff.
Limitations
This study has several limitations. First, while we used maximum likelihood (ML) estimation for factor analysis, the items on the MBI-HSS are ordinal in nature, and alternative estimation methods such as diagonally weighted least squares (DWLS) may be more appropriate for such data. We conducted diagnostic checks and found that assumptions for ML were reasonably met: the sample size was adequate (n = 361), skewness and kurtosis values were within acceptable ranges, and Q–Q plots indicated approximate multivariate normality. Furthermore, ML estimation has been widely used in prior MBI-HSS validation studies. Nonetheless, the choice of estimator may influence parameter estimates, and this should be considered when interpreting the results. Second, the cross-sectional design of the study limits the ability to infer causal relationships between burnout levels and associated factors. Longitudinal research is needed to examine how burnout evolves over time and in response to organisational or policy changes. Third, several items in the factor analysis exhibited moderate cross-loadings, particularly between the emotional exhaustion and depersonalisation dimensions. While all retained items met minimum loading criteria and contributed to acceptable reliability, cross-loadings can raise concerns about construct clarity. This issue is not uncommon in burnout research and was managed according to accepted psychometric guidelines; however, it remains a potential source of interpretive ambiguity. Lastly, while the factor analysis identified a structure consistent with the original MBI-HSS domains, the model explained 45.9% of the variance, which represents moderate explanatory power. This suggests that additional factors not captured in the current model may also contribute to burnout among nurses. Future research could explore complementary variables or alternative model specifications to improve explanatory strength.
Funding
None
Conflict of interest
None